Getting started with data visualization with Dash and recent search counts
Getting started with data visualization
Getting started with data visualization with Dash and recent search counts
By Jessica Garson
Let’s say you want to create a webpage where you can visualize how often you are Tweeting. For example, you could use the recent Tweets counts endpoint and Dash to create a website that automatically refreshes to show how much you are Tweeting throughout the week. This tutorial assumes a basic understanding of Python and Python 3 installed on your machine.
Endpoints
Resources

pip3 install dash
Additionally, you also want to install dash-bootstrap components to customize the look and feel of our page.
pip3 install dash-bootstrap-components
Getting started with the Twitter API
With this tutorial, you’ll be using the Tweet counts endpoint that returns the frequency of your Tweets over the last seven days.
Before you can use the Twitter API v2, you will need a developer account. Once you have an approved developer account, you will need to create a Project in the developer portal. Each Project contains an App, with which you can generate the credentials required to use the Twitter API. You can learn more about getting started with the Twitter API in the getting started section of our documentation. You can also start making calls on our developer playground.
To connect to the Twitter API, we’ll be using the requests package of Python. You will need to install this and pandas to help us get our data into the right shape. You can use dash-bootstrap-components to customize the look and feel of your webpage a bit further.
      pip3 install requests
pip3 install pandas
Setting up your app.py file
To start writing code to create your web application, you will need to set up an app.py file. In your terminal, you will want to make a python file entitled app.py.
touch app.py
Importing packages
Dash utilizes the plotting library Plotly. Plotly is an open-source plotting package, and you can check out the documentation, which might help debug some issues you may encounter.
In the code editor of your choosing, open up your app.py file. At the top of the file, you will need to define the packages you want to import.
      import dash
import dash_bootstrap_components as dbc
import plotly.express as px
import pandas as pd
import os
import requests
from dash import dcc
from dash import html
Creating the app variable
After importing the packages, you will need to create a variable called app. In this variable, you are initializing the app you are making and pulling in the bootstrap theme of journal. Using a bootstrap theme is just one way that you can start customizing your page.
      app = dash.Dash(external_stylesheets=[dbc.themes.JOURNAL])
server = app.server
Defining the endpoint URL and setting up your query parameters
Before connecting to the Twitter API, you can set the URL to the endpoint you are calling. For this example, you will be calling the recent Tweet counts endpoint, and you will save that as a variable called search_url
search_url = "https://api.x.com/2/tweets/counts/recent"
Next, you’ll want to set up a dictionary for query_params to define the query and granularity of the counts you’ll get back. In the parameter entitled query, you can specify the rules of what will get returned from the Twitter API. In the example below, the query is set to be all Tweets from the handle @jessicagarson. You can swap this out for your handle if you wish. To learn more about creating a query, check out our documentation on the subject.
With the granularity parameter, you can adjust the timing of the counts you’ll have returned. For example, you will get back hourly data instead of daily if you don’t specify ‘day’ in the granularity parameter.
query_params = {'query': 'from:jessicagarson','granularity': 'day'}
Authenticating to the Twitter API
You will want to set up an environment variable in your terminal to save your Bearer Token to your request. Then, you need to replace your-bearer-token with your Bearer Token. Be sure to keep the single quotes around your Bearer Token. You can get your Bearer Token from the keys and tokens section of your App inside the developer portal.
export BEARER_TOKEN='your-bearer-token'
Define a variable set to bearer_token in your code editor, and use the os module to get the bearer_token environment variable set in the terminal.
bearer_token = os.environ.get('BEARER_TOKEN')
Pass your Bearer Token as a parameter to create the headers to authenticate to the Twitter API as part of a method.
      def bearer_oauth(r):
    r.headers["Authorization"] = f"Bearer {bearer_token}"
    r.headers["User-Agent"] = "GettingStartedDash"
    return r
Connecting to the Twitter API
Create a function to connect to the Twitter API and get back a JSON response if you’ve successfully connected. This function has some additional error handling and will print out the response code you get to help with debugging.
      def connect_to_endpoint(url, tweet_fields):
    response = requests.request("GET", url, auth=bearer_oauth, params=tweet_fields)
    print(response.status_code)
    if response.status_code != 200:
        raise Exception(
            "Request returned an error: {} {}".format(
                response.status_code, response.text
            )
        )
    return response.json()
Now, you can call the function you created with the URL for the Tweet counts endpoint, our authentication headers, and the query parameters you defined earlier.
json_response = connect_to_endpoint(search_url, query_params)
Creating a data frame
Next, you can convert the JSON object returned from the Twitter API into a pandas data frame. Using a data frame allows you to work with the data more robustly and gets our data into the correct format to create a plot with Dash. For our purposes, you’ll only need to work with the data object of the JSON payload you get from the Twitter API, so you can convert only that into a data frame using pandas.
df = pd.DataFrame(json_response['data'])
You’ll also need to convert the date to a universal date object which you can do with the to_datetime method in pandas.
df['start'] = pd.to_datetime(df['start'])
Since you’ll only need the start and tweet_count columns, you can create a new data frame called final that selects only these columns.
final = df[['start', 'tweet_count']]
Now you are ready to create a line graph with our final data frame and set our x-axis and y-axis up.
fig = px.line(final, x="start", y="tweet_count")
Setting up your website
You can now start creating our website. You can begin by setting up the colors you want to use by creating a dictionary for the hex colors for our background and the text of our line graph.
      colors = {"background": "#FFFFFF", "text": "#1DA1F2"}

fig.update_layout(
    plot_bgcolor=colors["background"],
    paper_bgcolor=colors["background"],
    font_color=colors["text"],
)
At this point, you are ready to tie it all together by setting up your app layout. You will first need to define your background color, followed by setting up your title as an H1 HTML element and a brief description of your graph. Additionally, you will need to set your chart with and unique id and set the figure equal to the fig.
      app.layout = html.Div(
    style={"backgroundColor": colors["background"]},
    children=[
        html.H1(
            children="Tweets by Date",
            style={"textAlign": "center", "color": colors["text"]},
        ),
        html.Div(
            children="An example using Dash and the Twitter API recent search counts to see how much I've been Tweeting this week",
            style={"textAlign": "center", "color": colors["text"]},
        ),
        dcc.Graph(id="example-twitter", figure=fig),
    ],
)
Finally, you will need to set the main statement at the end of your file to run in debug mode when it sets up a local server for you to run and view the code.
      if __name__ == "__main__":
    app.run_server(debug=True)
Running the Python file and deployment
Now that you’ve written the code needed for your Python file, you can run it locally. In your terminal, run the following command.
python3 app.py
Now in your terminal, you should see a response that looks similar to the following.
      200
Dash is running on http://127.0.0.1:8050/

 * Serving Flask app "app" (lazy loading)
 * Environment: production
   WARNING: This is a development server. Do not use it in a production deployment.
   Use a production WSGI server instead.
 * Debug mode: on
200
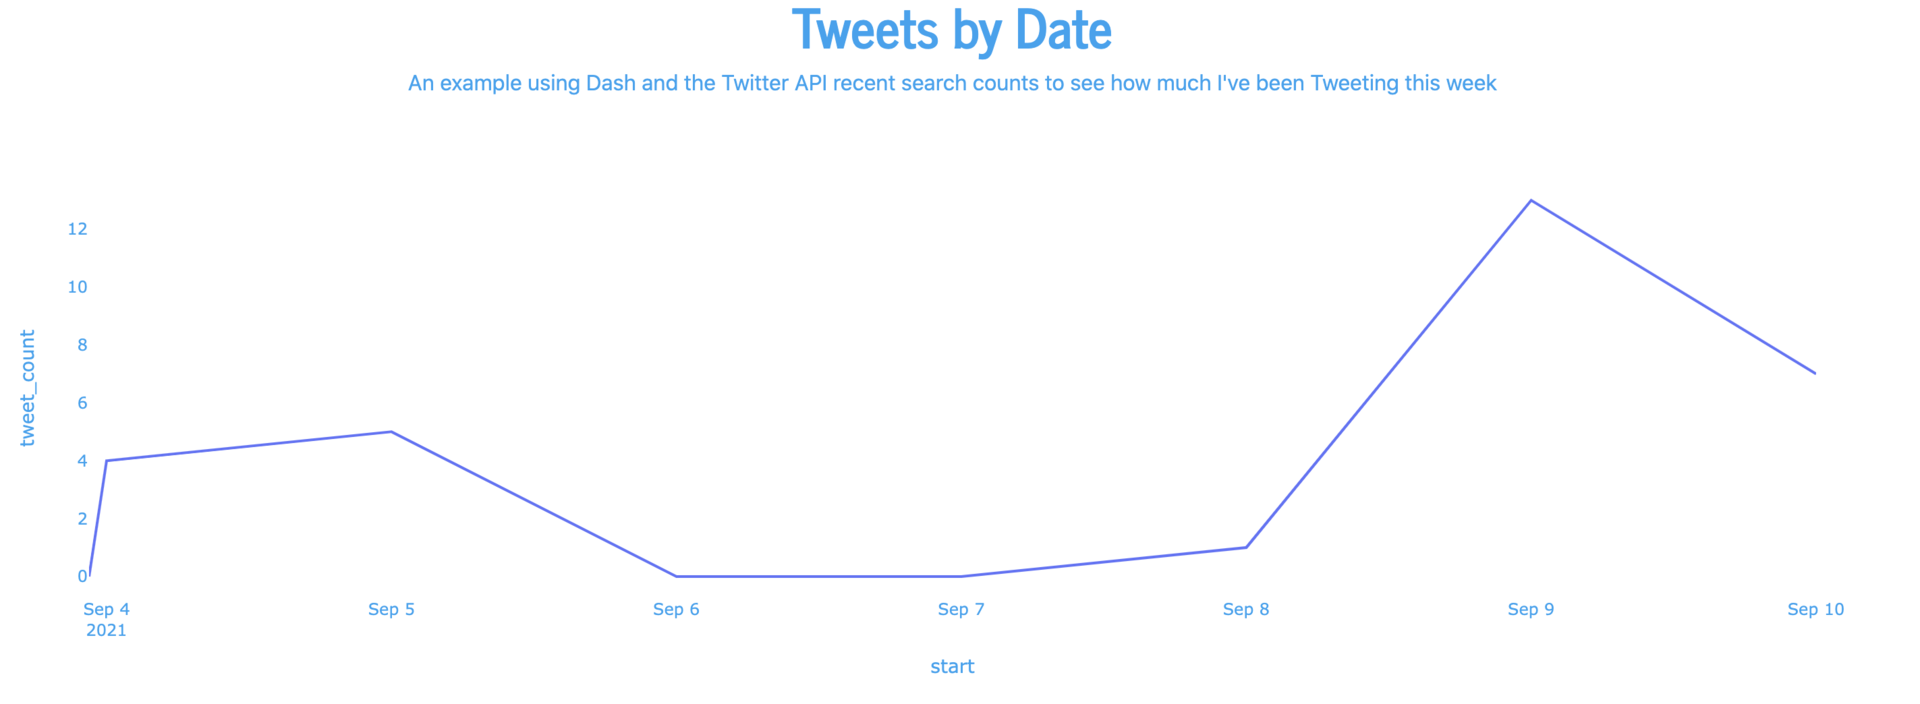
If you go to http://127.0.0.1:8050/ in your web browser. You should now see a graph that looks similar to the one below.
Deployment
This application is deployed to Glitch and can be remixed. This application is boosted using Glitch's pro plan to pull data more often.

Next steps
Hopefully, this tutorial can be a starting place to work with Dash and the Twitter API. You can view the full version of the code in our GitHub repository for this code sample. You can also check out a version deployed to Glitch.
As a next step, you may want to customize your query further to see how much you Tweet about a specific topic or how many times a particular term has been posted throughout the week. You may also want to add data visualization using a different Twitter API endpoint, such as searching for themes around what type of Tweets you like.
Be sure to let us know on the forums if you run into any troubles along the way, or Tweet us at @TwitterDev if this tutorial inspires you to create anything.